The Russell Stock Market Indexes
The Russell Stock Market Indexes includes several indexes covering a wide range of stocks that are grouped primarily by market capitalization and are used as either as benchmarks or for the selection of stocks in many financial products, such as exchange-traded funds. These indexes are maintained by the Russell Investment Group.
The Russell Investment Group
The Russell Investment Group, an investment service provider, is the sponsor and creator of the Russell indexes.
The Russell Investment Group evaluates fund managers for clients, such as mutual fund companies and companies with large pension funds, and the indexes are a main tool to see how well fund managers perform. The Russell indexes are based primarily on market capitalization, so if a fund manager can't perform better than a Russell index that mirrors the type of stocks that the fund invests in, then the fund manager isn't worth anything. Few mutual fund managers do better than the indexes, especially every year, so why not save on manager and active trading fees by buying the stocks that constitute an index, and simply hold it. That's the idea behind closed-end mutual funds based on indexes, and exchange-traded funds (ETFs), which have the lowest fees of any mutual fund. An exchange-traded fund buys the securities that constitute a specific index in proportion to their market capitalization, and issues new securities based on this basket of stocks. These ETF securities trade on the stock exchange just like any other stock.
| ETF Index | ETF Symbols |
|---|---|
| iShares Russell 1000 | IWB |
| iShares Russell 1000 Growth | IWF |
| iShares Russell 1000 Value | IWD |
| iShares Russell 2000 | IWM |
| iShares Russell 2000 Growth | IWO |
| iShares Russell 2000 Value | IWN |
| iShares Russell Microcap | IWC |
| iShares Russell 3000 | IWV |
| iShares Russell 3000 Growth | IWZ |
| iShares Russell 3000 Value | IWW |
| iShares Russell Midcap | IWR |
| iShares Russell Midcap Growth | IWP |
| iShares Russell Midcap Value | IWS |
| Rydex Russell Top 50 | XLG |
The Constitution of the Russell U.S. Equity Indexes
The primary consideration for inclusion in a Russell index is stock market capitalization. The Russell 3000E Index includes, despite its name, the largest 4000 publicly traded companies on American stock exchanges. All other Russell indexes are subsets of the Russell 3000E index. E stands for extended, because the Russell 3000 index is extended to include the 1,000 companies in the Russell Micro-Cap index that are not included in the regular Russell 3000 index.
The Russell 1000 consists of the largest 1,000 companies, which is further subdivided into the Russell Top 50 Index, the Russell 200 Index, and the Russell Mid-Cap Index. which consists of the smallest 800 companies of the Russell 1000. The Russell Top 50 consists of the 50 largest companies, and the Russell 200, the largest 200 companies. The Russell 2500 Index consists of the smallest 2500 companies of the Russell 3000. The Russell Micro-Cap Index includes the 1,000 smallest companies of the Russell 3000 and 1,000 companies that are right below the Russell 3000 in market capitalization rank. A special index called the Russell Small Cap Completeness Index consists of small-cap stocks not included in the S&P 500 index.

Companies excluded from the Russell indexes include OTC bulletin-board securities, pink sheets, stocks priced less than $1, and all companies not incorporated in the United States.
Index numbers may not be the exact number of stocks represented, because IPOs are added quarterly and deletions occur throughout the year through corporate actions, spin-offs, or delisting. Stocks removed during the year are not replaced.
The above indexes are core indexes, which are further subdivided into growth and value indexes, called style indexes. To create the style indexes, a composite value score is created by a special algorithm that depends on the price-to-book ratio and the I/B/E/S forecast long-term growth mean of each stock in a given core index. The stocks are then ranked based on this score to determine the classification of each stock as growth or value, or a combination. Thus, the Russell 2000 Value Index is composed of companies from the Russell 2000 which have a lower price-to-book ratio and lower forecasted growth rates. Note, however, that, despite the name, the Russell 2000 Value Index has fewer than 2000 stocks since the Value Index only represents a subset of the Russell 2000 that excludes growth companies.
Because the market capitalization of stocks changes all the time, the Russell indexes are completely reconstituted every year, so that stocks remain in the appropriate index. The preliminary index reconstitution is announced in mid-June based on market capitalizations as of May 31, and the reconstituted index will be effective the final Friday of June. Corporate actions or errors discovered before the final reconstitution can alter the membership of the Russell indexes slightly.
Profiting from the Russell Index Reconstitution
Traders make money on the annual Russell Index reconstitutions by buying before the fund managers buy. How profitable is this, really? When the list of additions was published for 2006, it was, evidently for some stocks, very profitable! These examples were picked randomly, and presented in the order picked. (Though these diagrams are old, they still have illustrative value.)
For instance, here's a 6 month chart of Amrep Corp. (AXR: Summary for AMREP CP NEW):
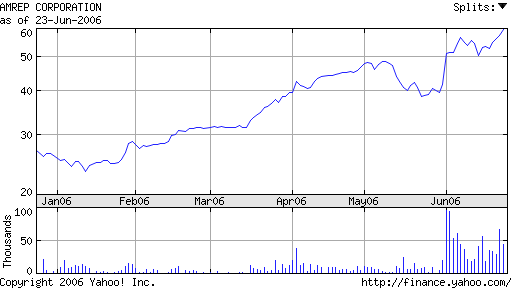
As you can see, Amrep went from about $25 in January to the latest quote of $59.75. That's about a 140% increase in about 6 months.
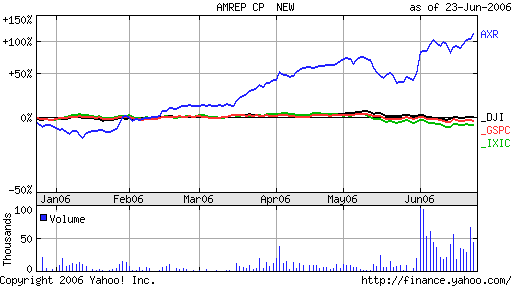
Here's a comparison of AXR with the 3 major indexes — the DJIA, the S&P 500, and the Nasdaq — over the same time period:
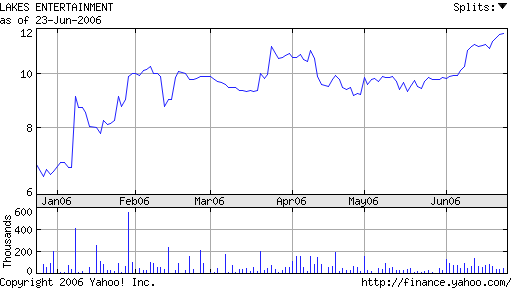
Here's another: Lakes Entertainment (LACO: Summary for LAKES ENTERTNMT), which went from less than $7 at the start of the year to $11.80.
PeopleSupport, Inc., (PSPT: Summary for PEOPLESUPPORT INC) went from a little over $8 in January to a little over $14 recently, settling down to $13.75.
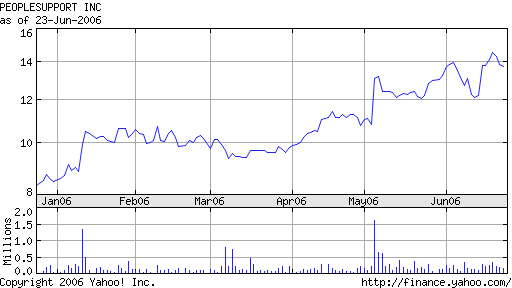
That's an increase of about 67% in 6 months!
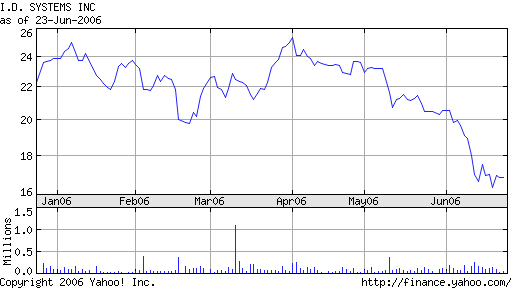
Here's one that lost during the time frame, I.D. Systems, Inc. (IDSY: Summary for ID SYSTEMS INC), although it did hold up well until May:
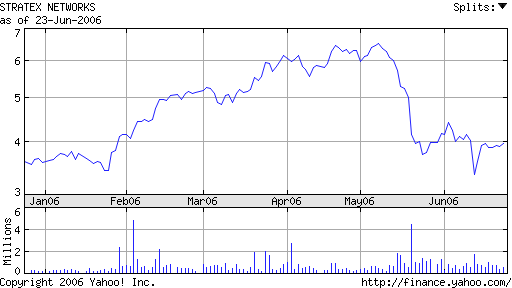
And here's the 6 month chart for Stratex Networks (STXN: Summary for STRATEX NTWKS INC), where the price peaked around late April and the beginning of May, then declined almost to where it was 6 months ago:
Anadys Pharmaceuticals, Inc. (ANDS: Summary for ANADYS PHARMACEUTICA) is another that declined after peaking about late March:
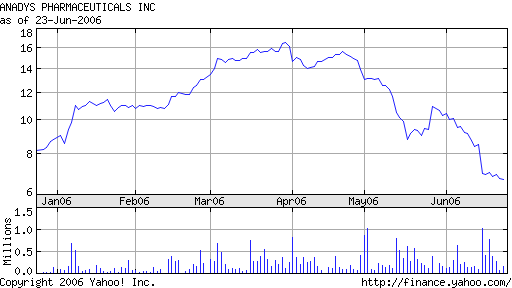
As you can see, some of these stocks peak around April, then decline. This indicates that active traders have bought by then, then buying declines.
What stocks are added to the Russell indexes are based mostly on market capitalization, and the indexes are reconstituted every year. Because about $3.8 trillion worth of index mutual funds and exchange-traded funds are benchmarked against the Russell indexes, any new additions to the Russell index are bought by the fund managers to reflect the changes. Active traders anticipate this by looking for companies that are increasing in market capitalizations, and thus, are likely to be added to the index in June. One study, published in the Financial Analysts Journal, found that between 1990 and 2002, index funds tracking the Russell 2000 suffered 1.3% - 1.84% through traders buying the stocks before the fund managers.
Of course, fund managers also try to determine what will be added to the index, because if they don't, they'll be buying the stocks at higher prices, which will hurt the fund performance. So, it is the combined buying by active traders and fund managers that drives up the stocks' prices before they are actually added to the index. No doubt some of the stock price declines results when the active traders sell for a profit.
Russell Global Equity Indexes
The Russell Investment Group has also developed the Russell Global Equity Indexes, which provide indexes for other countries, with sub-indexes of their regions and industries. This progression is natural because computers have greatly reduced the cost of computing indexes, and the investment world is becoming a more global one.