Price Channels, Envelopes, and Bands
The simple moving average (SMA) represents the trend of a stock, but actual prices fluctuate about this average. Various methods quantify how much prices fluctuate by constructing either price channels, or envelopes or bands around the moving average. Traders then use the upper and lower limits to either trade price extremes, especially in a sideways market, or to detect breakouts. Also, strongly trending prices tend to hug 1 of the boundaries. In an uptrend, prices hug the upper boundary, in a downtrend, the lower boundary.
Price Channels
The price channel has 2 lines on a price chart. The upper line is set at the highest high within a past period, called the n-period, and is usually 20 days. The lower line is formed by the lowest low within the n-period. The trading signals created by the price channel are simple — when there is a breakout above the upper line, buy it; when there is a breakout below the lower line, sell or sell short.
Percentage Envelopes
One simple way of constructing an envelope is by taking a percentage of the simple moving average, then both adding and subtracting it from the SMA to create an envelope around the price fluctuations. The boundaries of the envelope from the SMA are fixed. The percentages chosen should be great enough to eliminate much noise and to reduce the number of trading signals to what the trader prefers but small enough to produce some signals.
The percentages used should be tested since even small changes can cause large changes in profits or losses.
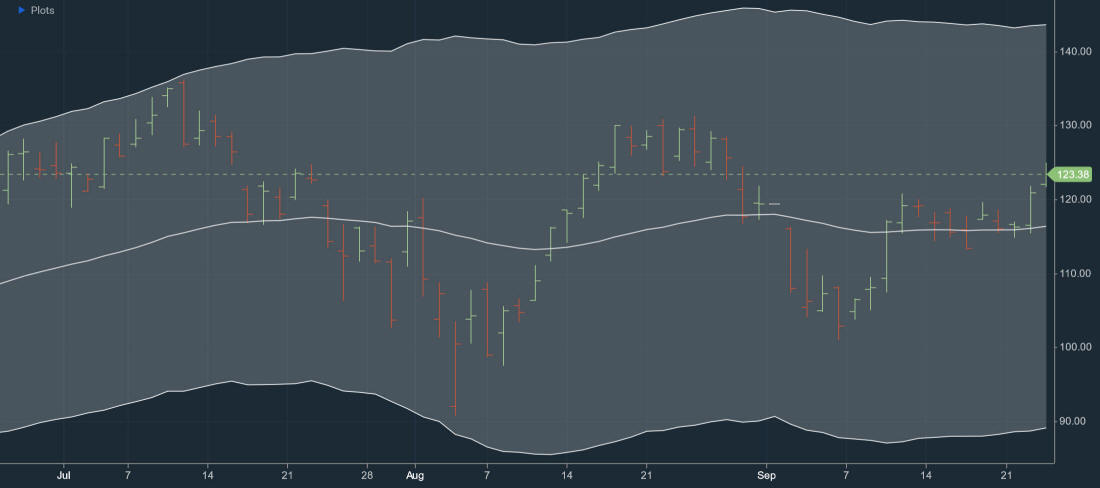
Bands
The disadvantage of envelopes is that their boundaries do not expand or contract with volatility. Hence, if volatility increases, then the envelopes will not encompass much of the price variations, generating too many false signals for a swing trader; if volatility decreases, then the boundaries will be too far from prices, generating few, if any, signals.
To accommodate volatility, bands, which are distinguished from envelopes by their variable widths, are constructed around the moving average, using some measure of the volatility of prices. The most common measure of volatility is the standard deviation, and the most common band that makes use of the standard deviation is Bollinger bands.
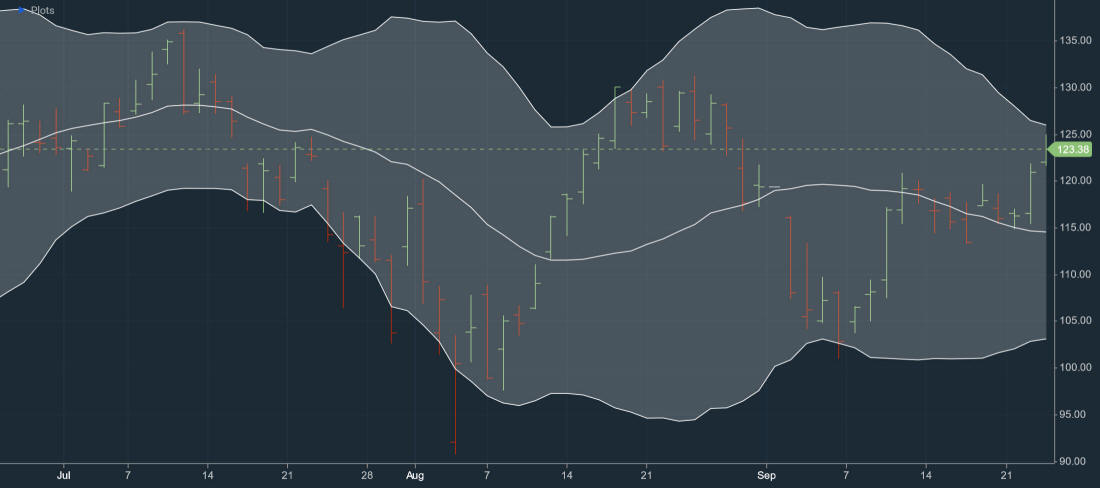
Bollinger Bands
Created by John Bollinger in the early 1980's, Bollinger bands typically use a 20-day simple moving average with lines both above and below the SMA representing 2 standard deviations of the SMA that expand and contract with volatility. The number of days or the number of standard deviations can be varied to suit your trading objectives and methods.
The SMA is the middle band, the upper line, the upper band, and the lower line, the lower band. The interval between the upper band and lower band widens as volatility increases and narrows as it decreases. The standard deviation is calculated using the same prices to calculate the moving average.
In statistics, with truly random data, 2 standard deviations would encompass 95% of all data. However, in trending financial markets, the upper and lower bands encompass fewer prices than would be the case for truly random prices. In an uptrend, prices hug the upper band, while in a downtrend, prices hug the lower band.
Keltner Bands (aka Keltner Channels, ATR Bands)
Chester Keltner created another type of band that varies with the volatility of the market. First, daily prices are averaged using this formula:
Average Price = (Close + High + Low) / 3
Then a 10-day simple moving average is calculated for these prices. The bands are created by calculating a 10-day moving average for the average true range (ATR) of the same prices, then this SMA is added and subtracted from the SMA for prices.